Baker School District students improve on half of state assessment tests, but remain well below pre-pandemic levels
Published 10:19 am Thursday, October 3, 2024
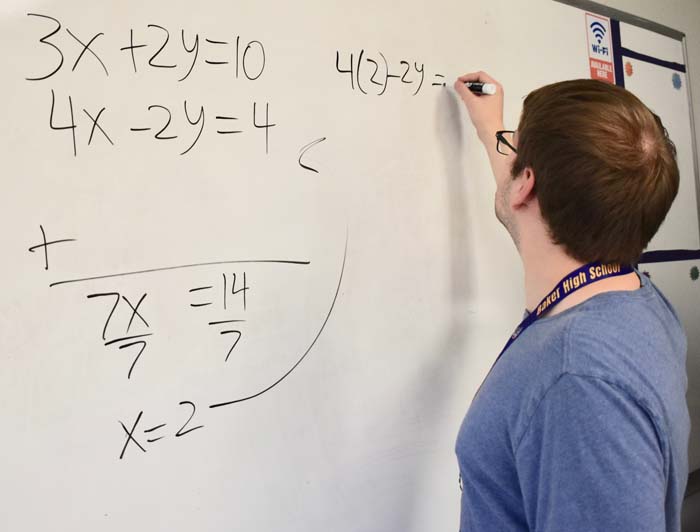
- Jordan Beery, a math teacher at Baker High School, demonstrates the time it takes to solve a problem by hand, versus using an app that does the work for the student.
Baker School District students improved their scores on half of statewide assessment tests last spring compared to the year before, but in most cases students have yet to reach levels from before the pandemic.
Students in grades 3, 4, 5, 6, 7, 8 and 11 can take tests in English/language arts and math. Students in grades 5, 8 and 11 can take the science test.
Students can opt out of the tests with their parents’ approval.
In the Baker School District, the percentage of students taking the tests in 2024 and 2023 was generally well below the statewide average at Baker High School, Baker Middle School, Brooklyn Primary and South Baker Intermediate Schools.
Participation rates were lowest among 11th graders at BHS.
In 2024, fewer than one-third of juniors took the tests. The participation rate was 17% for English (statewide average was 72%), 22% for math (68% statewide) and 27% for science (73% statewide).
The participation rate among juniors at BHS has declined significantly compared with the pre-pandemic era. In 2018, the participation rate for juniors was 87% for English/language arts, 95% for math and 86% for science.
Participation rates at Haines Elementary exceeded the state average for most tests in both 2024 and 2023, just as they did in 2018.
Baker superintendent Casey Hallgarth, who started the job in July of this year, said he wants to understand some of the factors that might be contributing to the major drop in the number of BHS juniors taking the state tests.
Hallgarth said he will be meeting with district leaders on Oct. 11 to talk about that trend.
Hallgarth said that although he supports the rights of parents to choose not to have their children take the tests, he also wants to make sure parents understand that test results are one of the important gauges that district teachers and administrators can use to measure how students are doing.
“This is a good gauge,” he said on Thursday, Oct. 10.
With fewer than one in five BHS juniors taking some of the tests, Hallgarth said the results have little value in reflecting how proficient that class of students actually is.
Pandemic plunge
Oregon canceled testing in 2020 and 2021 due to COVID-19.
Testing resumed in 2022, and in most cases both in the Baker School District and statewide, the percentage of students meeting proficiency levels on tests dropped substantially.
So did the percentage of students taking the tests, in many districts.
According to the Oregon Department of Education, “proficient refers to the achievement level that students achieve and whether they are on track to be college and career ready once they graduate from high school.”
Oregon and nine other states use Smarter Balanced Assessment English/language arts, math and science tests, which include open-ended questions and performance tasks as well as multiple-choice questions.
A higher percentage of Baker students were proficient in some tests in 2023 and 2024 compared with 2022, the first post-pandemic testing.
But in almost all tests and grades, Baker students’ proficiency levels are below the 2019 and 2017 tests.
Improvement
Students in some schools made gains from 2023 to 2024 in the math test.
At Brooklyn Primary, 28% of third graders were proficient in 2024, compared with 19% the previous year.
At BHS, 23% of juniors were proficient in the math test in 2024, up from 12% in 2023 and 2022. However, just 22% of juniors took the test, well below the state average of 68%.
BHS juniors exceeded the state average of 20% proficiency.
The statewide average for third graders is 40%, exceeding the Brooklyn Primary average.
The Brooklyn and BHS results for 2023 and 2024 were below the pre-pandemic (2019 and 2017) proficiency levels, however.
Districtwide, students improved in five of the 11 math tests in 2024, and in six of 11 English/language arts tests.
In the four science tests, proficiency levels improved in two and declined in two.
Baker High School, 11th grade
(percentage of students at proficient level)
2024: 20% (state avg: 45%)
2023: 28%
2022: 31%
2019: 70%
2017: 76%
Baker Middle School, 7th grade
Participation rate, 2024: 60%
2024: 37% (state avg: 43%)
2023: 36%
2022: 48%
2019: 60%
2017: 43%
Baker Middle School, 8th grade
Participation rate, 2024: 57%
2024: 36% (state avg: 41%)
2023: 49%
2022: 62%
2019: 45%
2017: 52%
Brooklyn Primary, 3rd grade
Participation rate, 2024: 60%
2024: 35% (state avg: 39%)
2023: 27%
2022: 32%
2019: 41%
2017: 46%
Haines Elementary, 3rd grade
Participation rate, 2024: 95%
2024: 74% (state avg: 39%)
2023: 84%
2022: 47%
2019: 91%
2017: 87%
South Baker Intermediate, 4th grade
Participation rate, 2024: 71%
2024: 29% (state avg: 42%)
2023: 28%
2022: 42%
2019: 41%
2017: 38%
Haines Elementary, 4th grade
Participation rate, 2024: 80%
2024: 85% (state avg: 42%)
2023: 79%
2022: 80%
2019: 83%
2017: 59%
South Baker Intermediate, 5th grade
Participation rate, 2024: 72%
2024: 48% (state avg: 47%)
2023: 40% (state avg: 47%)
2022: 36%
2019: 53%
2017: 47%
Haines Elementary, 5th grade
Participation rate, 2024: 100%
2024: 53% (state avg: 47%)
2023: 59%
2022: 73%
2019: 75%
2017: 68%
South Baker Intermediate, 6th grade
Participation rate, 2024: 68%
2024: 41% (state avg: 41%)
2023: 44%
2022: 32%
2019: 48%
2017: 42%
Haines Elementary, 6th grade
Participation rate, 2024: 95%
2024: 74% (state avg: 41%)
2023: 64%
2022: 73%
2019: 67%
2017: 79%
Baker High School, 11th grade
(percentage of students at proficient level)
2024: 23% (state avg: 20%)
2023: 12%
2022: 12%
2019: 37%
2017: 42%
Baker Middle School, 7th grade
2024: 33% (state avg: 31%)
2023: 38%
2022: 36%
2019: 38%
2017: 36%
Baker Middle School, 8th grade
2024: 33% (state avg. 26%)
2023: 40%
2022: 43%
2019: 34%
2017: 28%
Brooklyn Primary, 3rd grade
2024: 28% (state avg: 40%)
2023: 19%
2022: 34%
2019: 37%
2017: 48%
Haines Elementary, 3rd grade
2024: 63% (state avg: 40%)
2023: 84%
2022: 56%
2019: 86%
2017: 65%
Haines Elementary, 4th grade
2024: 90% (state avg: 38%)
2023: 50%
2022: 53%
2019: 83%
2017: 64%
Haines Elementary, 5th grade
2024: 53% (state avg: 31%)
2023: 41%
2022: 47%
2019: 43%
2017: 59%
Haines Elementary, 6th grade
2024: 37% (state avg: 28%)
2023: 29%
2022: 46%
2019: 57%
2017: 63%
South Baker Intermediate, 4th grade
2024: 23% (state avg: 38%)
2023: 29%
2022: 33%
2019: 43%
2017: 50%
South Baker Intermediate, 5th grade
2024: 23% (state avg: 31%)
2023: 26%
2022: 32%
2019: 42%
2017: 35%
South Baker Intermediate, 6th grade
2024: 26% (state avg: 28%)
2023: 40%
2022: 36%
2019: 39%
2017: 34%
Baker High School, 11th grade
(percentage of students at proficient level)
2024: 36% (state avg: 32%)
2023: 44%
2022: 28%
2019: 53%
2017: 80%
Baker Middle School, 8th graders
2024: 24% (state avg: 26%)
2023: 28%
2022: 35%
2019: 36%
2017: 67%
Haines Elementary, 5th graders
2024: 58% (state avg: 31%)
2023: 46%
2022: 47%
2019: 36%
2017: 73%
South Baker Intermediate, 5th graders
2024: 38% (state avg: 31%)
2023: 33%
2022: 33%
2019: 41%
2017: 60%
ENGLISH/LANGUAGE ARTS
Baker High School, 11th grade
2024: 17% (state avg: 72%)
2023: 39% (state avg: 71%)
2018: 87%
Baker Middle School, 7th grade
2024: 60% (state avg: 91%)
2023: 74% (state avg: 90%)
2018: 94%
Baker Middle School, 8th grade
2024: 57% (state avg: 88%)
2023: 93% (state avg: 89%)
2018: 91%
Brooklyn Primary, 3rd grade
2024: 60% (state avg: 94%)
2023: 89% (state avg: 94%)
2018: 94%
Haines Elementary, 3rd grade
2024: 95% (state avg: 94%)
2023: 83% (state avg: 94%)
2018: 100%
Haines Elementary, 4th grade
2024: 80% (state avg: 94%)
2023: 86% (state avg: 94%)
2018: 100%
Haines Elementary, 5th grade
2024: 100% (state avg: 94%)
2023: 100% (state avg: 93%)
2018: 94%
Haines Elementary, 6th grade
2024: 95% (state avg: 92%)
2023: 78% (state avg: 92%)
2018: 95%
South Baker Intermediate, 4th grade
2024: 71% (state avg: 94%)
2023: 68% (state avg: 94%)
2018: 97%
South Baker Intermediate, 5th grade
2024: 72% (state avg: 94%)
2023: 78% (state avg: 93%)
2018: 98%
South Baker Intermediate, 6th grade
2024: 68% (state avg: 92%)
2023: 70% (state avg: 92%)
2018: 98%
MATH
Baker High School, 11th grade
2024: 22% (state avg: 68%)
2023: 21% (state avg: 68%)
2018: 95%
Baker Middle School, 7th grade
2024: 60% (state avg: 90%)
2023: 74% (state avg: 89%)
2018: 91%
Baker Middle School, 8th grade
2024: 57% (state avg: 87%)
2023: 93% (state avg: 87%)
2018: 95%
Brooklyn Primary, 3rd grade
2024: 60% (state avg: 94%)
2023: 88% (state avg: 94%)
2018: 95%
Haines Elementary, 3rd grade
2024: 95% (state avg: 94%)
2023: 83% (state avg: 94%)
2018: 100%
Haines Elementary, 4th grade
2024: 80% (state avg: 93%)
2023: 91% (state avg: 93%)
2018: 100%
Haines Elementary, 5th grade
2024:100% (state avg: 94%)
2023: 100% (state avg: 93%)
2018: 94%
Haines Elementary, 6th grade
2024: 95% (state avg: 92%)
2023: 78% (state avg: 92%)
2018: 96%
South Baker Intermediate, 4th grade
2024: 71% (state avg: 93%)
2023: 67% (state avg: 93%)
2018: 98%
South Baker Intermediate, 5th grade
2024: 72% (state avg: 94%)
2023: 77% (state avg: 93%)
2018: 98%
South Baker Intermediate, 6th grade
2024: 69% (state avg: 92%)
2023: 70% (state avg: 92%)
2018: 98%
SCIENCE
Baker High School, 11th grade
2024: 27% (state avg: 73%)
2023: 22% (state avg: 70%)
2018: 86%
Baker Middle School, 8th grade
2024: 95% (state avg: 90%)
2023: 95% (state avg: 89%)
2018: 96%
Haines Elementary, 5th grade
2024: 100% (state avg: 95%)
2023: 100% (state avg: 94%)
2018: 100%
South Baker Intermediate, 5th grade
2024: 92% (state avg: 95%)
2023: 92% (state avg: 94%)
2018: 100%