Baker City population rising, according to estimate
Published 10:00 am Thursday, May 18, 2023
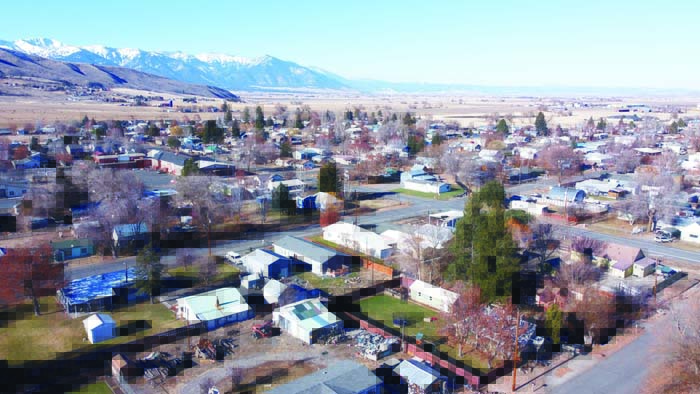
- Appraisers from the Baker County Assessor's Office are appraising real market values of residential properties in Baker City. (Jayson Jacoby/Baker City Herald, File)
After reaching a milestone of 10,000 residents in the 2020 Census, Baker City has continued to add population, according to the Portland State University Population Research Center.
Trending
Baker City’s official population in 2020 was 10,099.
It was the first time the city topped 10,000 in an official U.S. Census.
Portland State, which estimates city and county populations each year between the once-per-decade federal censuses, pegs Baker City’s population as of July 1, 2022, at 10,263. That’s a 1.6% increase since 2020.
Trending
Baker County’s population was 16,668 in the 2020 Census. Portland State’s estimate for July 1, 2022, was 17,148. Most of the increase is in unincorporated parts of the county, which went from 4,931 in the 2020 Census to 5,217.
Portland State’s figures are estimates, based on housing starts and other data. The U.S. Census is an actual attempt to count residents through questionnaires and household visits.
Baker City was platted in 1865 and incorporated in 1874. Its population was first counted in the 1870 federal census, which tallied 312 residents.
Prior to 2020, the city’s peak population in a census was 9,986, in 1960.
The city grew for each of its first nine decades. But starting with the 1960s, the city started a sequence of adding population in one decade followed by a loss of residents the next. That has continued since, with the population declining during the 1960s, 1980s and 2000s, and growing during the 1970s, 1990s and 2010s.
Those alternating trends make Baker City unique among Oregon cities with a population of 10,000 or more. The other cities have generally added residents each decade.
Baker City and Bend, for instance, were of similar size until the 1970s, when the latter city began a growth spurt that accelerated rapidly in the last decade of the 20th century.
In 1930, Bend was only slightly larger than Baker City, with 8,848 residents to Baker City’s 7,858.
Bend’s margin widened over the next few decades but not dramatically — in the 1970 Census Bend’s population had grown to 13,710, while Baker City was home to 9,354 residents.
By 1990 Bend was more than twice as large, with 20,469 residents to Baker City’s 9,140.
During the 1990s, though, Bend’s population more than doubled, reaching 52,029 by the 2000 Census. Its population in 2020 was 99,178, and Portland State’s estimate for July 1, 2022, was 102,834.
Neighboring cities along the I-84 corridor have all grown consistently during the past several decades, albeit at rates much below those of Bend.
La Grande, for instance, gained residents every decade from 1950 to 2020, with the largest increase being 17.7% during the 1970s.
La Grande surpassed Baker City during the 1960s, reaching a population of 9,645 in the 1970 Census, to Baker City’s 9,354. La Grande’s 2020 Census population was 13,025, and Portland State’s estimate for 2022 was 13,404.
Ontario has added residents in every decade since the 1930s, and Pendleton’s population has grown every decade except the 1960s, when it dropped by 8.6%.
Ontario had a population of 11,645 in the 2020 census, and an estimate of 11,845 in 2022.
Pendleton’s population in the 2020 Census was 17,107, and its 2022 estimate was 16,894.
Adding the fifth digit moved Baker City into the “medium-size” city category, Holly Kerns, director of the Baker City/County Planning Department, said in 2021 after the 2020 Census results were released.
That means the city now has to do an annual report on housing units permitted and produced, and the city also has to conduct a housing needs analysis every six to eight years, followed by a housing production strategy.
Contributing trends
Based on statistics from 2010-19, it appears that the city’s population increase was driven by people moving to the area.
According to the Oregon Health Authority, Baker County recorded 2,096 deaths and 1,625 births from 2010-19 — a net loss of 471 residents.
Those are county totals, but about 80% of the total births were to residents in the 97814 ZIP code, and about 77% of the deaths. That ZIP code, however, does include parts of Baker Valley and other areas outside the Baker City limits.
Another telling statistic is the number of active utility accounts inside the city.
That number rose by 128 from December 2015 to December 2020, according to the city — from 4,151 to 4,279.
Other incorporated cities in Baker County
• Haines: 373 (2020 Census), 383 (2022 estimate)
• Halfway: 351 (357)
• Huntington: 502 (510)
• Richland: 165 (166)
• Sumpter: 204 (209)
• Unity: 40 (40)
• Greenhorn: 3 (3)
Elsewhere in Eastern Oregon
• North Powder: 504 (500)
• Union: 2,152 (2,154)
• Elgin: 1,717 (1,778)
• Island City: 1,144 (1,144)
• John Day: 1,664 (1,667)
• Canyon City: 660 (676)
• Prairie City: 841 (842)
• Granite: 32 (32)
• Vale: 1,894 (1,916)
• Nyssa: 3,198 (3,314)
• Heppner: 1,187 (1,182)
• Boardman: 3,828 (4,116)
• Hermiston: 19,354 (19,973)
• Milton-Freewater: 7,151 (7,197)
• Umatilla: 7,363 (7,632)
• Enterprise: 2,052 (2,126)
• Joseph: 1,154 (1,173)
• Wallowa: 796 (809)
Baker City’s population has been unusually steady, among Oregon cities with more than 5,000 residents. Most of those cities have grown over the past several decades, at varying rates, but Baker City’s population stayed between 9,134 and 9,986 between the 1940 and 2010 censuses. The city’s population at each U.S. Census:
• 1870 — 321
• 1880 — 1,258 (+303%)
• 1890 — 2,604 (+107%)
• 1900 — 6,663 (+156%)
• 1910 — 6,742 (+1.2%)
• 1920 — 7,729 (+14.6%)
• 1930 — 7,858 (+1.7%)
• 1940 — 9,342 (+18.9%)
• 1950 — 9,471 (+1.4%)
• 1960 — 9,986 (+5.4%)
• 1970 — 9,354 (-6.3%)
• 1980 — 9,471 (+1.3%)
• 1990 — 9,140 (-3.5%)
• 2000 — 9,860 (+7.9%)
• 2010 — 9,828 (-0.3%)
• 2020 — 10,099 (+2.8%)
Marketplace


-
eEdition

-

-
