County questions COVID-19 testing discrepancy
Published 8:46 am Wednesday, February 3, 2021
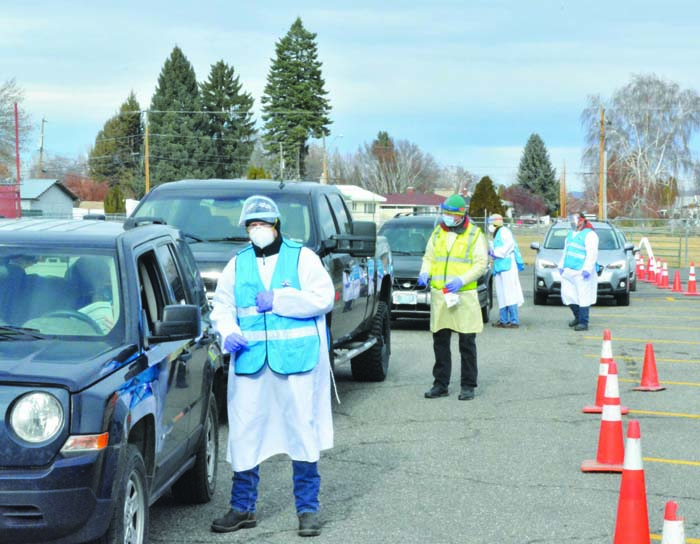
- A total of 86 Baker County residents were tested for COVID-19 during a free drive-thru clinic Jan. 6 at Baker High School. Two out of the 86 people tested positive.
Baker County Commissioner Mark Bennett and other county officials are trying to ensure that the county’s significant decline in new COVID-19 cases over the past two weeks results in an easing of restrictions on local businesses and other activities.
Bennett said he’s concerned, though, that an apparent discrepancy in the county’s positive test totals for the virus could offset, at least partially, the benefits of the downward trend in recorded infections.
“None of us can explain it,” said Bennett, who has headed the county’s response to the pandemic since March 2020.
The number of positive tests attributed to the county is vital because the rate of positive tests is one of two measures that determine the county’s risk level and resulting state-imposed restrictions.
The other measure is the number of new COVID-19 cases over a two-week period. Based on the new case count for the current period — Jan. 24-Feb. 6 — the county is on pace to drop from the extreme-risk category, which has the most severe restrictions, including a ban on indoor restaurant dining, to lower risk, which has the least stringent restrictions.
However, the county’s current test positivity rate of about 7.9% would put the county in the moderate-risk category.
Baker County has been in the extreme-risk category for all but two weeks since the state started the current four-level system (lower, moderate, high and extreme) on Dec. 3. The county was in the high-risk category from Jan. 1-14.
The state is slated to reassess risk levels early next week, with any changes to take effect Feb. 12.
Bennett said he and other members of the county’s leadership team, including Dr. Eric Lamb, the county’s public health officer, Nancy Staten, director of the Baker County Health Department, and Jason Yencopal, emergency management director, had a Zoom meeting on Monday, Feb. 1, with officials from the Oregon Health Authority (OHA) and Dr. Dean Sidelinger, state epidemiologist.
But Bennett said that meeting didn’t yield an explanation for why, according to records posted on OHA’s website, Baker County has had almost three times more positive tests for COVID-19 than it has had actual cases.
“Why are we the anomaly in the state?” Bennett said.
State Rep. Mark Owens, R-Crane, who represents Baker County in the Oregon Legislature, said on Tuesday, Feb. 2, that he has also asked OHA about the discrepancy between positive tests and total cases, but to no avail.
“I can’t explain it to you,” Owens said.
Jonathan Modie, a spokesman for the OHA, wrote in an email to the Herald that one explanation for a county having more positive tests than cases is that an individual who tests positive multiple times would count as a single case, but each positive test would be attributed to the county where that person lives.
As of Wednesday, Feb. 3, OHA showed the county with 1,619 positive tests since the start of the pandemic, and a total of 595 cases.
The latter figure includes five new cases on Tuesday, the highest one-day total since Jan. 15.
Although 12 of Oregon’s 35 other counties also have had more positive tests than cases, according to OHA data, Baker County’s differential is much greater than in any other county.
Baker County has had 2.7 times more positive tests than total cases.
Lincoln County, a coastal county that includes Newport and Lincoln City, has the second-largest difference, with slightly less than twice as many positive tests (2,074) as cases (1,069).
In addition to the questions regarding positive tests, Bennett said he and other county officials have lobbied state officials to move Baker County from the group of medium-size counties — those with a population range of 15,000 to 29,999 — to the roster of small-population counties, those with fewer than 15,000 residents.
There are eight counties in each group now.
Baker County’s population of 16,800 is by far the smallest among the medium-size counties. The next-smallest county, Curry, at the state’s southwest corner, has 23,005 residents, 37% more than Baker County.
Bennett contends the state should have made 20,000, not 15,000, the dividing line between small and medium counties.
Baker County would be the biggest county in the small category, with a population 24% larger than the next-biggest county, Morrow.
Oregon counties and risk level metrics
LARGE (Population 30,000 or more) — 20
• Benton, Clackamas, Clatsop, Columbia, Coos, Deschutes, Douglas, Jackson, Josephine, Klamath, Lane, Lincoln, Linn, Malheur, Marion, Multnomah, Polk, Umatilla, Washington, Yamhill
• Risk level for these counties is based on their rate of COVID-19 cases per 100,000 residents.
MEDIUM (Population 15,000 to 29,999) — 8
• Baker — 16,820
• Crook — 23,440
• Curry — 23,005
• Hood River — 25,480
• Jefferson — 23,840
• Tillamook — 26,500
• Union — 26,840
• Wasco — 27,240
• Risk level for these counties is based on two measures: number of COVID-19 cases, and test positivity rate
SMALL (Population less than 15,000) — 8
• Gilliam — 1,990
• Grant — 7,360
• Harney — 7,360
• Lake — 8,080
• Morrow — 12,680
• Sherman — 1,770
• Wallowa — 7,150
• Wheeler — 1,440
• Risk level for these counties is based on the number of new COVID-19 cases